

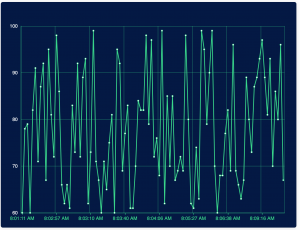
Echarts 最近有个需求要求是做个心电图的效果:
主要参考:
https://echarts.apache.org/zh/api.html#echartsInstance.setOption
chart.setOption(option, notMerge, lazyUpdate);

var min = 60;
var max = 100;
var date = (function() {
    var now = new Date();
    var res = [];
    var len = 100;
    while (len--) {
        res.unshift(now.toLocaleTimeString());
        now = new Date(now - 1000);
    }
    return res;

})();
var randomData = (function() {
    var res = [];
    var len = 100;
    while (len--) {
        res.push(Math.floor(min + Math.random() * (max - min)));
    }
    return res;
})();
option = {
    color: ['#2DDB89'],
    backgroundColor: '#031845',
    tooltip: {
        trigger: 'axis',
        axisPointer: { // 坐标轴指示器,坐标轴触发有效
            type: 'shadow' // 默认为直线,可选为:'line' | 'shadow'
        }
    },
    grid: {
        left: '3%',
        right: '4%',
        bottom: '3%',
        containLabel: true
    },
    xAxis: [{
        type: 'category',
        data: date,
        axisTick: {
            alignWithLabel: true
        },
        axisLabel: {
            color: '#2DDB89'
        },
        splitLine: {
            show: true,
            lineStyle: {
                color: '#2DDB89',
                width: 0.5
            }
        },
        axisLine: {
            lineStyle: {
                color: '#2DDB89'
            }
        }
    }],
    yAxis: [{
        type: 'value',
        min: 60,
        max: 100,
        axisLabel: {
            color: '#fff'
        },
        splitLine: {
            show: true,
            lineStyle: {
                color: '#2DDB89',
                width: 0.5
            }
        },
        axisLine: {
            lineStyle: {
                color: '#2DDB89'
            }
        },
        axisTick: {
            show: false
        }
    }],
    series: [{
        name: '直接访问',
        data: randomData,
        type: 'line'
    }]
};
var len = date.length;
// 使用刚指定的配置项和数据显示图表。
myChart.setOption(option);
setInterval(function() {
    // 主要是这里
    randomData.push(Math.floor(min + Math.random() * (max - min)));
    randomData.shift();

    date.push((new Date()).toLocaleTimeString());
    date.shift();

    myChart.setOption({
        xAxis: {
            data: date
        },
        series: [{
            data: randomData
        }]
    });
}, 1000)
https://www.makeapie.cn/echarts_content/xHklmmH-Pm.html
https://echarts.apache.org/examples/zh/editor.html?c=dynamic-data&reset=1&edit=1